Creating a Function in a Graph
1. Click the gear icon in the upper-right corner of the Graph window to see the commands in the Graph Gear drop-down menu.
2. Choose Plot Function, as shown here.

3. The "y = " formula box will appear at the top of the graph.
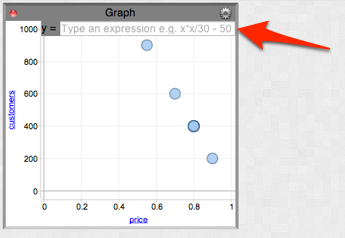
4. Type your function into the formula box in terms of x, rather than using the variable shown on the horizontal axis of your graph. For example, "y = 3*x^2 + 5."